Measurements via digital controller
Return to Compass315M controller page
KTP temp scanning
Below are pics of scans over the KTP temperature. Note the many peaks - one needs to find an overall optimum for the three KTP, RES, and LD temperatures (whose settings even influence each other) for any fixed given value of laser diode current. This is no easy task and I wonder how a) the original controller is doing this automatically in a reliable way and b) how people can to this "by hand".
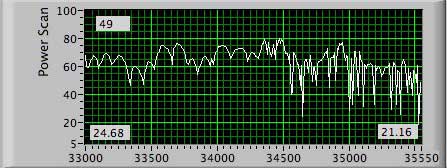
What worries me are the wild fluctuations - this is more pronounced at higher laser diode currents. It seems that there are zones of stability and instability. Below a pic for 1.7A current which demonstrates this: to the left, there is a quiet zone with smooth peaks. To the right (where the KTP temperature is lower) an unstable zone appears, where the pattern is quite chaotic:

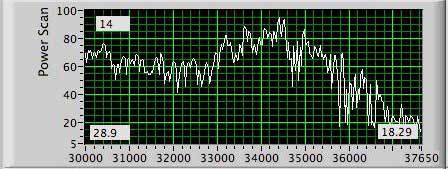
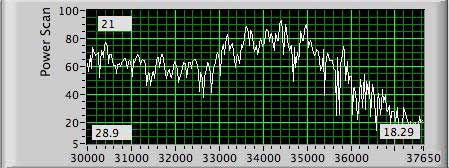
(numbers in the lower left and right corners indicate start and stop temperatures in degrees C; y-axis is milliwatts, calibrated with an Ophir thermistor; x-axis is 16 bit thermistor voltage, ie. 65536 corresponds to 4096mV).
In unstable zones, the output power wildly fluctuates even when all temperatures are kept constant... this is of no use for holography ! I could obtain highest power (>110mW) only within such unstable zones. On the other hand, tuning to a peak in a stable zone (like the one near 33700 in the plot above) gives little less power but this absolutely constant without any visible mode jumps, for extended periods of time.
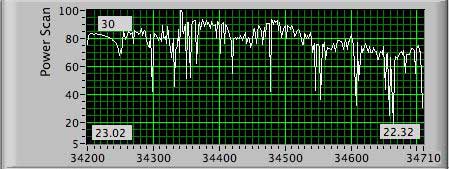
Below a zoom-in to a chaotic, unstable peak region, the total span being 0.7 degrees:
Here a zoom-in around the best stable peak I found at I=1.95A, the total span is ca 0.2 degrees:
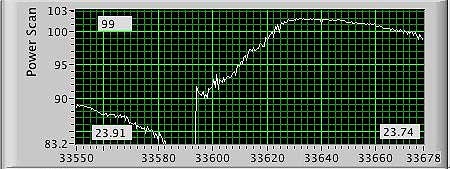
To demonstrate to what extent 16 bit resolution is necessary: 12 bit resolution would correspond to steps of 16 on the x-axis (for orientation, the fat vertical lines denote steps of 20). Given that the ADC reading will alwas jump up and down by a few bits, this shows that 12 bit resolution is at the borderline for optimally adjusting the KTP temperature.
----------------------
Here views for two scans over more ca 10 degrees C for LD current=1.9A. The similarity of the curves shows to what extent the measurements are reproducible and meaningful:
LD temp scanning
Laser diode temperature is not critical, stabilization to one degree or so is sufficient (which corresponds to ca 0.3nm shift of the 808nm pump wavelength):
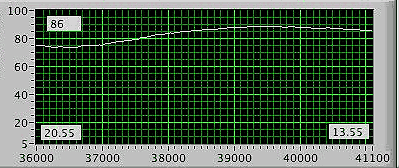
(this shows a 7C temperature span).
RES temp scanning
Cavity temperature scan shows nice mode jumps, but these are quite mild tempered:
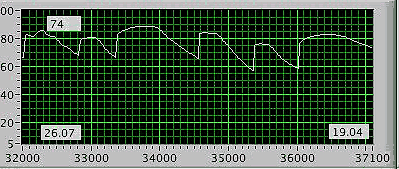
Thus16 bit temp resolution is not required for the resonator temperature.
These findings (period in the order of 1C) are different to what is found in SAM's FAQ, where a period of 0.04C for resonator temp changes is reported.
TEC regulator loop responses
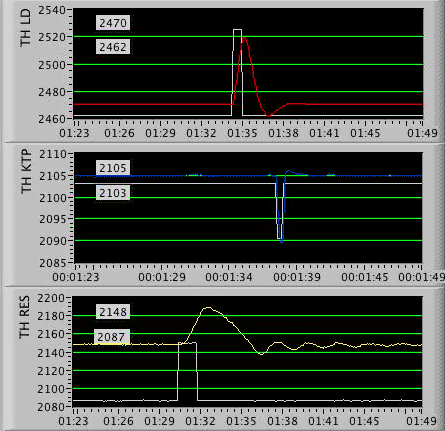
Below a pic which shows the step responses of the three TEC temperatures upon a sudden change in control voltage (white lines = control input, colored lines = thermistor voltages in mV). This shows that the KTP TEC has a very short resonse time, and the LD TEC has a critically damped resonse with very little swing as well. The RES TEC is closer to oscillating, and takes quite a bit of time until settling back to equilibrium.
